
Working notes on how to compare different approaches to science funding. Focuses on clarifying several challenges that must be addressed for such comparisons to be meaningful. We'd love to hear thoughtful comments and corrections, including pointers to related work. (Please leave comments at the bottom).
There's a striking vision, now gaining momentum, where we "turn the scientific method on ourselves"1, in part to help improve our scientific institutions. This vision is exciting, since the quality of humanity's scientific institutions so strongly influences our collective future. It's also challenging: one major obstacle is understanding how to do experiments which figure out what works, and what does not. Informally, we've heard people advocate: "we should do lots of RCTs [randomized controlled trials] for science funding schemes!"2. This seems like a promising idea, perhaps a way to develop funding approaches far better than the peer-reviewed grant approach that currently dominates.
We wrote these notes to improve our thinking about how to compare funding schemes. In particular, we discuss three challenges in running and analyzing such experiments: (1) performance in science is plausibly dominated by outlier discoveries, not typical discoveries, making many common statistics misleading; (2) performance is plausibly non-stationary: the same outliers don't recur, and may even change the underlying system; (3) different approaches to funding shape who applies for funding, and what they apply with. All three challenges need to be addressed in any comparison of funding approaches. We won't solve these problems; nor are we the first to highlight them. Mostly we're just articulating and exploring the problems, to help stimulate thinking about solutions.
These notes are in part a response to the paper "Incentives and Creativity: Evidence from the Academic Life Sciences", by Azoulay, Graff Zivin, and Manso (AGZM)3. AGZM compare scientists working within the HHMI Investigator program to those working within the NIH system. It's not a randomized controlled experiment – there's (currently) no way of randomizing scientists into HHMI or the NIH – but it's RCT-like. In particular, AGZM work hard to make a fair like-to-like comparison, so the HHMI program can plausibly be considered an intervention, and NIH a control4. They obtain many striking results, including finding a 39% increase in publication output for HHMI-funded scientists; furthermore, that increase becomes 96% when focused on papers in the top 1% of the citation distribution.
It's a beautiful paper. It's often held up as a prototype for how to compare funding schemes or institutions. Indeed, we've heard people suggest that similar comparisons should be done at scale, a sort of production line for science funding RCTs, perhaps through a J-PAL-like organization. Part of the motivation for these notes is to think through some challenges in making that idea work.
The notes are a small part of a larger project. We're interested in the social processes of science – things like peer review, the PhD system, centralized grant funding, and so on. We believe vastly better social processes are possible in science. Of course, there's a long and venerable tradition of people proposing improvements! From grumbling at conferences and on Twitter, to the pages of Nature, to thoughtful monographs, to extensive trials. However, at present the social processes mostly change only very slowly, despite clear problems. Can we imagine and create a world in which science rapidly and routinely greatly improves its social processes? For this to happen we need good ways to identify when changes actually are improvements. Thus these notes.
There's a romantic version of the history of science in which it's all about the great discoveries – Galileo and his telescopes, Darwin on the Beagle, and so on. It makes for fun and perhaps informative stories. However, some people retort that focusing on the great discoveries is actually misleading. Such "outlier" discoveries usually come out of a rich surrounding context of "minor" discoveries – small increments or even errors or false trails – which are later forgotten by all but historians, but which were crucial to the evolution of humanity's understanding.
This may seem a debate of mostly philosophical interest. While we won't resolve it, we believe it's crucial in thinking about how to fund science. To see why, it helps to first discuss another area of human endeavor, venture capital (VC) investment, where it's easier to quantify whether outliers dominate. In VC, it has become common (though not universal) wisdom that returns on investment are dominated by outliers. Here's leading venture capitalist Peter Thiel5 on the issue. Keep in mind: we're certainly not saying science is venture capital; indeed, we're not even certain Thiel is right about VC in general. The point here is merely to give an example where outliers plausibly dominate:
Venture returns don't follow a normal distribution overall. Rather, they follow a power law: a small handful of companies radically outperform all others… Our results at Founders Fund [Thiel's VC firm] illustrate this skewed pattern: Facebook, the best investment in our 2005 fund, returned more than all the others combined. Palantir, the second-best investment, is set to return more than the sum of every other investment aside from Facebook. This highly uneven pattern is not unusual: we see it in all our other funds as well. The biggest secret in venture capital is that the best investment in a successful fund equals or outperforms the entire rest of the fund combined. This implies two very strange rules for VCs. First, only invest in companies that have the potential to return the value of the entire fund. This is a scary rule, because it eliminates the vast majority of possible investments. (Even quite successful companies usually succeed on a more humble scale.) This leads to rule number two: because rule number one is so restrictive, there can't be any other rules.
It's tempting to just nod along at all this. But it violates much of our intuition from everyday life, and from much conventional training. If you're a careful, analytically trained thinker, it's tempting to think that you should analyze venture capital by building a large body of evidence, perhaps by sampling a large number of companies. But if you believe Thiel, then the things you learn may, if you're not careful, actually be to your disadvantage. Why? Because by definition you'll be learning about merely good or great companies. That's the part of the curve you're trying to get away from: your goal is to get as far into the right of the curve as possible. But it's less clear how to take a data-based approach to studying that part of the curve. By definition you are in the realm of anecdotal outlier success. And such anecdotal outlier success may be a more useful teacher than heavily data-based studies of the bulk of the curve. This is a crucial point, since it's in stark contrast to much conventional wisdom about how to study things seriously6.
Imagine you were trying to learn how best to do the high jump in athletics. One approach is to sample from the worldwide distribution of high jumpers. Maybe you look at 100, chosen at random from the millions of people who compete in high jump at least occasionally. You could almost certainly learn some useful things about technique this way. But you would learn far more if you also examined the right tail – the very best high jumpers in the world. Fortunately, that is possible in high jump, where the best jumpers often compete against one another. It's harder in VC, where you're trying to make inferences about performance years in the future, based on very early data. It's even harder in science, which additionally suffers from the challenge that it's extremely difficult to quantify the value of a discovery.
But even in high jump, the situation is harder than we have made out. Suppose in 1964 you'd traveled to the Olympic Games, and made a careful study of the world's best high jumpers. You would have learned a lot – about the wrong things. At the next Olympic Games, in 1968, the high jump was won by an American named Dick Fosbury, using a radically different style than anyone had ever used at the Olympics before. Fosbury was the first leading high jumper to go "back first" over the bar, in the style now known as the Fosbury Flop. In 1964, he'd been in high school, but his style of jumping had achieved some notoriety in newspapers – not because it was successful, but because reporters wanted to mock him. He was described in one article as looking like "a fish flopping in a boat", and in another as "the world's laziest high jumper"7.
There are two lessons here.
First: today's outliers may be an extremely misleading guide to tomorrow's. It's easy to think you've determined a general law – "it's best to go over the bar front first", "successful founders behave like Mark Zuckerberg or Steve Jobs [etc]" – when you're merely overfitting to extremely limited data. Now you might object that of course no-one would be silly enough to conclude that they should prefer to invest in startup founders who wear hoodies. But how do you sort out the spurious signals from the informative signals? Should you prefer founders who dropped out of top universities? Is Fosbury's style of high jumping the best possible? Or is something still better possible?
Second: today's outliers often change the landscape around them; they may even reshape the distribution. In the high jump, other jumpers quickly copied Fosbury. According to Wikipedia, at the next Olympics, in 1972, 28 of 40 entrants used the Fosbury flop. In the VC case, the landscape may also change radically, albeit in a very different pattern: cloning Facebook was a recipe for failure. The position was already taken; Facebook reshaped the landscape around it, closing off some opportunities, and opening up others8.
Earlier, we said that a problem with learning about the bulk of the curve in VC is that it's "the part of the curve you're trying to get away from". You might retort that that's obviously nonsense, since carefully studying the bulk of the curve will help you reason about outliers. There's at least some truth to that: for instance, Thiel's statement about outlier-domination could only come from studying the entire curve! But as a matter of practice, the VCs we know often talk (and presumably think) very differently: they're trying to identify companies different in some crucial, fundamental way than anything they've seen before. In that sense, they study the bulk of the curve in order to escape it, almost an anti-inductivist approach.
Of course, science is not venture capital or high jump. There are many fundamental differences, and it would be a bad mistake to uncritically base conclusions on such comparisons. Perhaps most fundamentally, it's not possible to neatly quantify the value of scientific discoveries in a commodity-like way. Indeed, arguably it's a mistake to attempt to quantify their value at all. Such discoveries are not fungible, nor do they add up. You can't measure the value of new scientific discoveries in units of milli-CRISPRs (say), and pile up three dozen 30 milli-CRISPR discoveries to get something more important than CRISPR. How many milli-CRISPRs was General Relativity? More or less than 27,000? It's all a little ridiculous.
We hope you'll allow us a brief dramatic indulgence on the virtues and demerits of quantification. It's from the movie "Dead Poet's Society", telling the story of a high school English teacher, Mr. Keating (played by Robin Williams), and his relationship with his students. Early in the movie Mr. Keating asks one of the students to read aloud to the class a passage from a textbook on "Understanding Poetry". In the passage, the author – the wonderfully named Dr. J. Evans Pritchard, PhD – suggests the key to enjoying poetry is to quantitatively assess both the importance of the subject of the poem, and also the perfection of the poem. This, he tells us, makes "determining the poem's greatness a relatively simple matter": you multiply the importance by the perfection, and that tells you how great the poem is.
Poetic greatness, reduced to a formula!
As the students bow their heads, diligently copying down this formula, Mr. Keating turns to the class and pronounces his judgment: "Excrement! That's what I think of Mr. J. Evans Pritchard. We're not laying pipe. We're talking about poetry… [sarcastically] 'Oh I like Byron, I gave him a 42, but I can't dance to him.'… Armies of academics going forward, measuring poetry – no! We'll not have that here, no more of Mr. J. Evans Pritchard."
Science isn't laying pipe, either. And there's something surreal about the idea of doing RCTs (or RCT-likes) to compare quantitative valuations of different funding schemes.
Can you imagine someone doing RCTs on poetry? On art schools?
Shakespeare didn't learn to write using RCTs; nor did Picasso learn to paint that way. And Bauhaus wasn't the result of a series of carefully controlled methodological studies. Scientific institution building is, similarly, an act of imaginative creation. And given that, you might reasonably throw your hands up in the air and declare: "It's ridiculous to be comparing funding schemes at all".
But we won't let ourselves off that easily. If we do, we're just implicitly accepting that the current system is the best possible. Do you really believe that? We do not! So: we're stuck with this question of how to make comparisons at some level of abstraction. Somehow, you wish to navigate the line between Dr. J. Evans Pritchard, PhD, with his foolish quantification, and using the romance of genius to justify a continuation of business-as-usual. Indeed: a Picasso or a Shakespeare (or would-be systemic patrons of such) may learn a great deal from careful, systematic investigation. But it must be at the service of, not the master of, their imagination and intuitive judgment.
If we have large-scale systems for supporting science, then there's just no way of wriggling out of this problem. And issues like the possibility of outlier dominance rear their head. To illustrate: suppose you decide to compare two funding schemes, based on a sample of discoveries made under the two schemes. That sounds reasonable. But merely by making the decision to sample, you're adopting a point of view that says "it's the more typical discoveries which matter, not the outliers". It may well be that an approach optimized for outlier outcomes actually does worse on typical outcomes. And improving typical outcomes may suppress outliers. The approach to analysis must contend with this outlier-vs-typical issue, even if you deny the possibility of numerically quantifying the value of discoveries.
In the case of AGZM, consider the 96% increase in top-1% cited papers for HHMI investigators. This certainly sounds very striking. It could be indicative of an improvement not just in typical performance, but also outlier performance. But it's not difficult to construct toy models in which the effect is due, say, to some more tightly-controlled standard of excellence. That is: perhaps the impact is due to an improvement in typical behavior combined with more control, narrowing the curve and reducing the impact of outliers, compared to what would otherwise have happened:
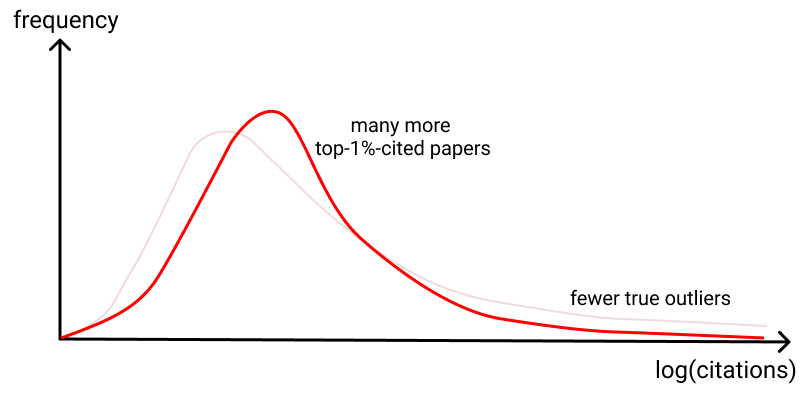
While an interesting possibility, this idea is almost certainly wrong. AGZM showed that HHMI investigators not only had more highly cited papers, they also had more low cited papers(!) than expected, based on their prior records. This is consistent with more risks being taken, with more unexpected successes, and also more duds. Thus, it would not surprise us if there were more true outlier successes. Still, there are distributions in which both these things are true, and yet the outliers (according to citation count) are still diminished:
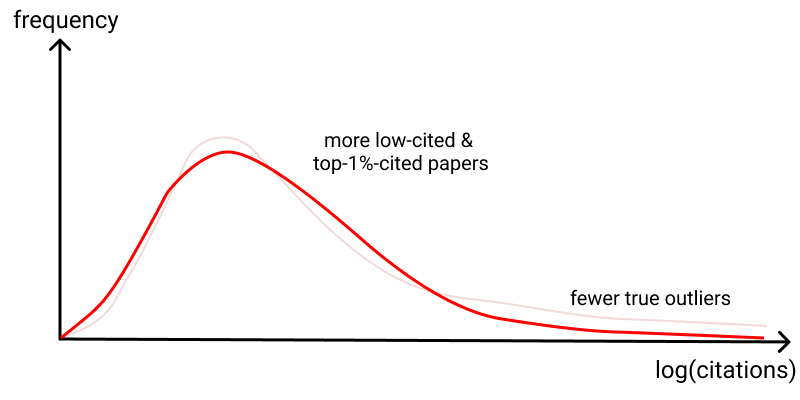
You may suspect this is unlikely. But it cannot be ruled out without a well-substantiated reason.
We believe it's crucial to examine outlier successes in evaluating (or comparing) any funding scheme(s). This needs to be done at least as seriously as the statistical analysis of the bulk of the curve. It may seem less serious – people sometimes feel embarrassed about relying on qualitative discussion of anecdotal stories9. By comparison large samples, randomized groups, and "careful" evidence-based reasoning seem more rigorous. But if there's even a chance that science may be outlier dominated, then that rigor is an illusion, confusing formality with correctness.
Suppose we take citations seriously as a proxy measure of the importance of a discovery. The citation distribution has, of course, been extensively studied. Analyses suggest10 that the probability density of citations C behaves something like 1/C3.16. Although this is heavy-tailed compared to things like the normal distribution, it is not actually outlier-dominated.
Of course, this does not disprove the outlier-dominated folk theory. Indeed, different funding schemes may well generate different shaped curves. If one funding scheme generates a citation distribution of 1/C1.9 then that will, in fact, be outlier dominated. But if a different scheme generates a citation distribution of 1/C4.2 then it behaves more in accord with conventional intuition, with a finite mean and variance, and the outliers only contribute a small fraction of total citations.
This may sound implausible. But something very much along these lines happens in venture capital. The results of Othman11 suggest that different investment strategies give rise to very different return curves. Very early stage investment plausibly has outlier-dominated returns, the analog of the 1/C1.9 model, while at later stages it becomes more like the 1/C4.2 case. It would be interesting to know whether an analogous result holds in science, with early papers in a new subfield following a different (age-adjusted) citation curve than later papers.
Of course, the use of citations is itself highly problematic. The study of the citation distribution is certainly of interest, but evaluating science by counting citations is a bit like evaluating basketball teams by adding up the heights of the players. It's not uninteresting, but nor is it anything like a reliable measure. We are, again, back to the non-fungibility of discovery: you don't add up ten 100 citation discoveries to get one 1,000-citation discovery.
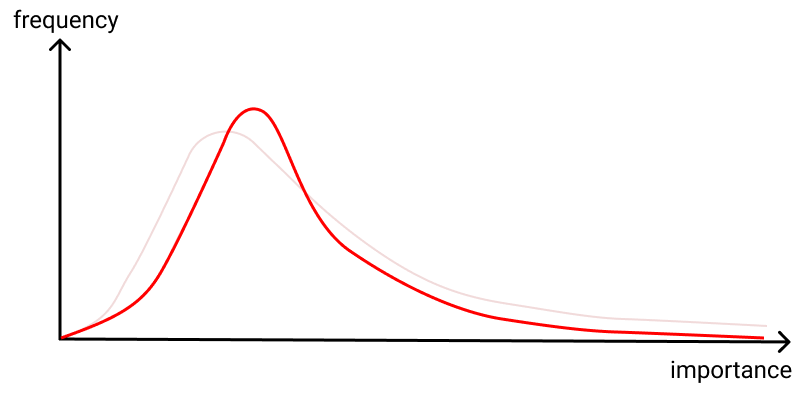
Rather than be stymied by the barrier of quantification, we can turn the problem around, and use it as an intuition pump. It suggests at least three different goals one might have in science funding. In one, the typical-behavior goal, you aim to shift measures of typical behavior (like, say, the median, or perhaps the 80th percentile) to the right. This is the kind of goal that, for example, more stringent peer review or processes like the UK's Research Excellence Framework seem to aim (in part) to serve. (Note that the diagram below perhaps looks similar to the earlier diagrams, but the labels on the axes have changed).
In another, the variance-based goal, you aim to increase the variance in outcomes, even if it worsens typical outcomes, because the compensating impact of more highly-dispersed outcomes more than outweighs it:
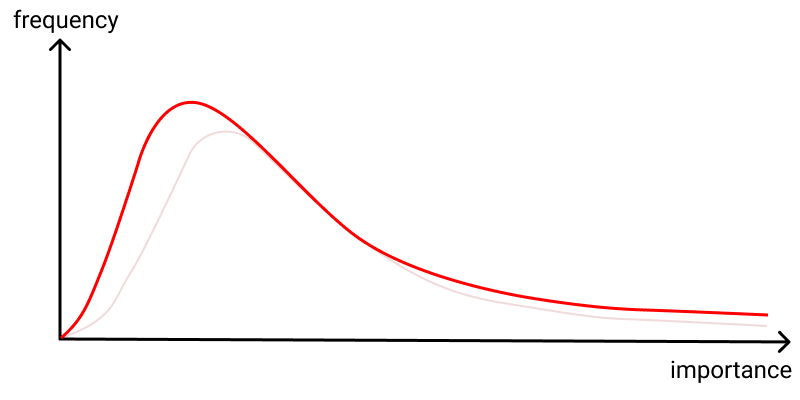
If you pick this goal, you might value grants that are highly polarizing between reviewers (some love it, some hate it), perhaps using something like the variance or kurtosis of scores as a primary signal. Such variance-based funding might well decrease the quality of the typical output, as you give up control; but it may be compensated by the more highly dispersed outcomes. Another program suggested by this is a failure audit, whereby independent audits are run on grant programs, and if the failure rate isn't above some threshold, the program may be terminated. And yet a third might be to offer some form of tenure insurance12 to pre-tenure faculty, encouraging them to swing for the fences by ensuring a large pay out if they should fail to be tenured.
The third goal is the outlier-based goal, along the lines that Thiel states holds for many of his venture funds. Here, the value comes from the extreme outlier success, and the goal is simply to increase those. The interior of the curve doesn't matter, except insofar as it helps us understand the extreme behavior. Visually, it'll be hard to distinguish from the variance-based goal, but the intent is different and it's certainly possible to have either one without the other.
If you pick the outlier-based goal, you might fund things like a Century Grant Program, to elicit and fund extremely long-term projects, like the Framingham Heart Study or Mauna Loa Observatory or Cape Grim Air Archive, which create truly unique capacities. Or perhaps a Unique Individual Fellowship, for people who can credibly claim a combination of abilities unique in the history of humanity (think of people like William Dampier or Robert Ballard). Or Long-Shot Prizes, purchasing insurance premiums against extremely unlikely discoveries that would transform the world (a proof that P != NP; a proof that P=NP; cheap cold fusion; etc). The more unlikely the outcome, the higher the prize-to-premium ratio, and the more prize money you can award for a given premium.
The point is: depending on what you believe is really driving scientific progress you may choose different goals along these lines. And how you evaluate the degree of success of a scheme depends upon which camp you're in. Of course, we don't insist on this particular trio of goals; there are many other goals of interest13. Nor are the goals exclusive: choosing one does not necessarily imply rejecting the others. But there are tradeoffs and tensions between them.
In sketching the diagrams above we may appear to be accepting the idea of quantifying the value of discovery. In fact, we're not doing that: the models are intuition pumps only, simple models to aid reasoning and goal-setting. They are emphatically not an accurate depiction of reality: we can't measure those curves; indeed, we don't even know how to define them; even if we could define and measure those curves, we don't know which curve shapes would be preferable, and under what circumstances! We believe that attempting to precisely quantify the value of different discoveries is an activity which may generate valuable ideas; at the same time, it is misleading unless treated with great caution. That said, the value of such simple (if not literally true) models has been well elucidated by the economist Paul Krugman14:
Why, people will ask, should they be interested in a model with such silly assumptions… The reason for making these assumptions is not that they are reasonable but that they seem to help us produce models that are helpful metaphors for things that we think happen in the real world. What I believe is that the age of creative silliness is not past… If a new set of assumptions seems to yield a valuable set of insights, then never mind if they seem strange.
That's exactly right: the curves above are not based on reasonable assumptions. But, with due caution, we believe they are useful for better understanding how to think about the world, what to aim for, and how to proceed in analysis. It took us quite some time to reach this conclusion. On the one hand these curves are ridiculous, and at first it seemed silly (to use Krugman's word) to be writing about them. But they're gedankenmodels, simple heuristic models that can nonetheless be extremely helpful in understanding these problems much more deeply15.
There's a broader point here. At present most scientists don't take metascience terribly seriously. Perhaps because it's not yet a science! Indeed, large parts never will be, being instead a discipline of imaginative design, more akin to Picasso than Newton. But even many of those parts which one day may become a science are currently still a protoscience, a mish-mash of stories and informal ideas and simple models, scrambling around to gain purchase, with few general principles or high methodological standards. A lot of early ideas will no doubt later look hopelessly wrong.
How can you make progress in such a situation? The history of economics is inspiring. Of course, the full economy is vastly more complicated than we can understand. The solution isn't to build immensely complex models correctly modeling every last detail. Rather, it's to develop simple models which reveal important ideas – ideas like comparative advantage, marginal cost of production, price elasticity, the relationship between supply and demand, and so on. Those ideas have greatly increased our understanding of economics, even though they're not coming out of detailed models of the entire economy. Similarly, in metascience we believe there's great value in developing such generative models and ideas. They'll be inaccurate, even "wrong" in some ways. But they can also help us build up our understanding. To build further intuition about outlier-dominated models, we do some exploration in the Appendix at the end of these notes.
We remarked earlier that the nature of high jump completely changed between the 1968 and 1972 Olympics, thanks to the introduction of the Fosbury flop. That is, the underlying distribution was non-stationary: the way high jumpers trained and jumped was changing very rapidly. Of course, there are many senses in which this non-stationarity is true in science as well. Most obviously: the same big discovery doesn't happen twice16. And so: a funder never steps into the same river of discoveries twice. The act of discovery changes the scientific ecosystem around it. It's easy to get caught up trying to fund the successes of 10 or 20 or 50 years ago. Indeed, in a healthy ecosystem institutions would change and adapt in response to major successes (and major failures), introducing further non-stationarity. The healthier the ecosystem, the more non-stationary it is.
How do you avoid overfitting in a non-stationary, (plausibly) outlier-dominated setting? You're trying to learn from a tiny number of really successful examples. But while you want to learn from the past, you don't want to overfit, looking again for last decade's successes. It means generalizing from a deeper understanding than surface-level features, attempting to begin to develop good models of how discovery works.
In Venture Capital, many top investors emphasize that what they're looking for is things which are a little strange, a little weird. That is, they're not looking for things which look like last year's successes, but rather look fundamentally different in some hard-to-articulate way. Here's Marc Andreessen17:
So, the first thing is to be alive and alert in every interaction. And then somebody gives you big things/new areas. I call them “things from the future”. Something is happening in the world. It's only happening in one place. But…wow, it’s something that might end up actually ultimately happening everywhere. I’ll often ask those people who else I can talk to or what I can read.
Every once in a while, something nice happens. When I ask what can I read, they say…’well, there really isn't anything’. And that's just the best case scenario because that means we might be the first to it.
In the same interview, Andreessen describes VC as "very close-to-the-ground work". It's what may appear at first a curiously anecdotal approach. Abe Othman, the head of data science at AngelList, sums up the situation18:
Venture capital has largely resisted the quantification that has revolutionized modern finance. In lieu of mathematical modeling, venture capitalists tend to subscribe to pieces of folk wisdom around their investing activities. How, when, and in what a VC invests all tend to have only the thinnest veneer of theoretical or empirical justification.
It's most curious, because the modern finance world is, very roughly speaking, investing in the same companies as the VCs, just at a later stage in their life cycle. Indeed, sometimes it's even the same people doing the investing, as people move from traditional finance to VC and vice versa. However, Othman also points out that investment returns tend to become much less outlier dominated later in the life cycle of companies. Perhaps it's simply the market at work, with anecdotal strategies yielding better returns in an outlier-dominated situation, and more quantitative data-backed strategies yielding better returns when the bulk of the curve dominates.
Unfortunately, in science we don't have a good solution for what to do about the non-stationary nature of these distributions. We're just pointing out that it's a problem. In the AGZM paper, they focused on HHMI Investigators appointed in 1993, 1994, and 1995. An early version of the paper appeared in 2009, and it was published in 2011. Any policy actions taken as a result of the paper were still further in the future, a roughly two decade gap. It seems entirely plausible that any lessons from the paper were no longer true since the situation had changed so much. What, then, to learn? And how to deal with the non-stationarity?
Indeed, there can be non-stationarity at different levels of abstraction. At the individual company level, it may just mean that things too similar to Facebook don't recur. But there can also be changes at other levels of abstraction – for example, at the industry level. For instance, Othman suggests the idea of an index fund made up of early stage ventures. This would make it possible for investors to invest in a broad basket containing "all" (for some definition of "all") promising early-stage startups. This might sound challenging to achieve, but there are plausible ways it could be approximated. In 2011, the investor Yuri Milner announced19 that he would make a blanket investment offer to all companies completing the Y Combinator (YC) program. TechCrunch founder Michael Arrington described the terms as "the most entrepreneur friendly investment that I can think of, short of just handing people money as a gift." We don't know what fraction of YC companies afforded themselves of this opportunity, but the terms were so favorable that it's possible that many or perhaps most YC companies took the offer up. A similar strategy could perhaps be used to construct a broader index.
What would be the effect of such an index? If open to public investors, it might be very popular: unbounded average returns, if you believe Othman's model! And constructed in a way that greatly reduced the risk of investing in a single startup. But if it became popular it's plausible, for instance, that it would increase valuations across the board, since with more capital available, there would be more competition among traditional VCs (assuming a fixed body of companies [Of course, that wouldn't necessarily be true].) That might plausibly decrease the returns, making them less heavy tailed. We don't insist on this. But it's an example of a structural change that would plausibly drive persistent changes in the nature of the underlying distribution.
Of course, science is not VC, and we expect major differences. In particular, at present we expect VC to be much more non-stationary than science funding. There's a large number of VCs in fierce competition, each looking for ways to beat the overall VC market. In some sense, each is searching desperately for an informational or structural advantage: something they can learn (often from the past) that will give them an advantage, or some way they can reshape the market. By contrast, science funders are mostly not engaged in an existential competitive struggle. If they miss an investment, the General or Limited Partners don't miss out on billions of dollars. In this sense, VC is very strongly incentivized to learn as much as possible – sometimes, too much – from the past. While science funders don't change nearly as rapidly as we believe is desirable.
In experimental design, much care is often put into ensuring a randomization between control and intervention groups. But in science funding, the intervention used may shape who applies, and what they apply with, in crucial ways. In many instances we expect this would be a dominant effect. The point of things like the Century Grant Program, the Unique Individual Fellowship, and the Long-Shot Prizes is to elicit previously unsuspected proposals, perhaps from previously unheralded individuals. It's the elicited population and mindset which is of interest20.
As an example, the Villum Foundation in Denmark trialed a funding experiment that used two mechanisms to elicit more daring ideas. Grant applications were anonymous, to encourage scientists to apply who might have non-traditional backgrounds for the projects they proposed. And each grant reviewer got a "golden ticket", an ability to unilaterally decide to fund an application. The hope was to encourage people to submit grants which swung for the fences, finding at least one reviewer who loved the idea, even if the ambition put other reviewers off. According to the director of science at the foundation, Thomas Sinkjær21:
In a survey [of people receiving grants], about half of the recipients said that had the call for unorthodox ideas not been anonymous, they would not have proposed their winning idea — they didn’t think they had a shot if judged on their publishing track records. Reviewers said that they liked evaluating ideas without knowing the applicant’s past performance.
It's not obvious how to study this using RCT-like approaches. Who shows up isn't something to randomize away; it's actually a large part of the point. In some sense, the crafting of the program – what you're looking for – is a non-repeatable act of imaginative design. How best to do that is certainly of great interest, but we're not sure how to study the effectiveness.
To scale a Michelin restaurant to thousands of locations requires replacing superb individual taste with checklists and systems. The result is likely to be McDonald's, a bureaucratization of food. Of course McDonald's achieves something the Michelin restaurant does not: inexpensive food, delivered at scale. But the Michelin restaurant also achieves something McDonald's does not.
Insofar as metascience aims to systematize extraordinary science, it faces a similar challenge: "how can you bureaucratize genius?"22. It's tempting to laugh. Many people have told us system-level social changes matter little in science, that the best aspiration is to get out of the way of individual scientists. We believe they're wrong. We believe there is extraordinary latent potential for discovery, potential that may be released through improved social processes.
We wrote this note because we often encounter thoughtful people who say: "What science funding needs is far more rigorous experimentation, to figure out what works and what does not". We agree. But what does rigor mean? The mere appearance of rigor is not enough: it can be a form of "something must be done; this is something; therefore this must be done". But careful reasoning based on imperfect assumptions can lead to badly misleading conclusions. Initially we were enamoured of the approach in AGZM. We still admire it, but it's more a prototype than a finished approach, with many daunting challenges still to be overcome. But it's worth doubling down, not giving up. As we asked in the opening: can we imagine and create a world in which science rapidly and routinely greatly improves its social processes? We believe it's possible, and would be enormously beneficial for humanity.
In this appendix we do some numerical exploration of some outlier-dominated distributions. It's in the spirit of the Krugman quote: this certainly isn't an accurate model of science or VC (or high jump). But they are simple models which demonstrate just how strange outlier-dominated distributions can be. The exploration is intended to build insight and intuition about how such distributions behave. We did it to help us play the "what if" game: what if one of these models did partially capture something about science? The observations are not new, and they're far from complete. But we hope they're stimulating!
Our exploration will be done using power law distributions. In particular, we'll use a distribution for a random variable X for which the probability density is p(x) = 0 when x < 1, and when x \geq 1 the probability density is:
p(x) = (\alpha-1)x^{-\alpha} \,\,\,\, (x \geq 1)
Here, \alpha is the shape parameter, a measure of how heavy tailed the distribution is. We'll most often be interested in cases when 1 < \alpha < 2, which is when the distribution is especially heavy-tailed – so much so that it's actually outlier-dominated, and things like the expected value of X don't exist. If you keep drawing over and over from such a distribution, the average of the values will be unbounded. When 2 < \alpha < 3 it's not quite as heavy tailed, although it still has some unusual properties, including having an infinite variance. For larger values of \alpha it's less heavy tailed still, although it still has some unusual properties.
Computationally, a random variable like X is most easily generated by using a random variable U uniformly distributed on [0, 1] and setting X = U^{-1/(\alpha-1)}. We won't show here that this works, but an easy way to check is by integrating the probability density above to obtain the probability distribution for X, and then comparing to what you'd expect for U^{-1/(\alpha-1)}.
It's fun to simply go on numerical safari: in the remainder of this appendix we describe four striking properties of this distribution. And all the time we'll keep in the back of our mind the question: might science (or science funding) be something like this, under some funding scheme? The intent is to dramatize how strange an outlier-dominated world can be.
Power law distributions can be extremely outlier dominated, and show wild variation in those outliers, while being quite consistent in the main body of the curve: Suppose we sample 10,000 times from a power law distribution with shape parameter \alpha = 1.7. We did this numerically, and found that almost half – 49% – of the total came from the single largest value! That is: it was extremely outlier dominated! This is very much consistent with the picture Peter Thiel painted.
One strange thing, however, is that there's a lot of variation. If we repeat the experiment, we find that in the second repetition the leading term contributed "only" 21% of the total value. Of course, it's still enormous when you consider that's one sample out of 10,000. But it's a little less outlier dominated. If we do it again, we get 48%. And again we get 16%. And so on. So this distribution perhaps isn't quite as outlier dominated as Thiel suggests for VC. But it is very outlier dominated. And there's wild variation from run to run.
While the outliers may vary wildly, in fact the main bulk of the curve is fairly consistent. Suppose we again sample 10,000 times, with \alpha = 1.7. And suppose we find the total contributions in the bulk of the curve, excluding the 20 largest outliers. We did this ten times, and the results are plotted in the top of the graph below. As you can see, while there's some variation, there's actually not that much. But in the bottom graph, we plot the corresponding relative top-20 and top-1 outliers. And we again see wild variation, and that the outliers completely dominated over the bulk of the curve:
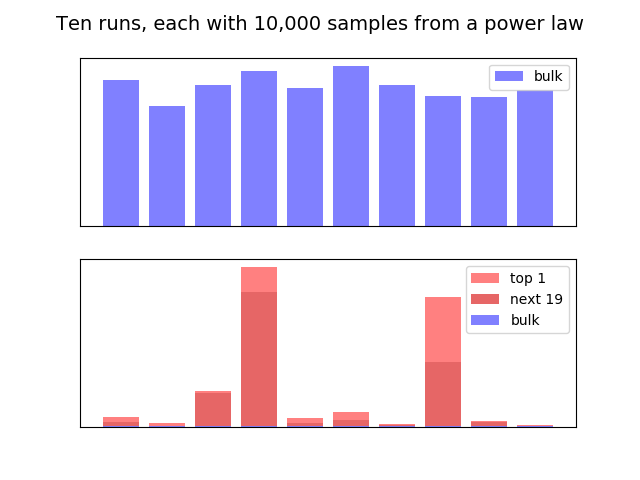
In the dry context of a Python script none of this seems especially surprising. But the real-world impact of such variation is extraordinary. Suppose this is an accurate model of VC (it's not, but it might contain some of the truth). And you have two VC's both doing the same kind of sampling. Lucky VC hits one or two big outliers, corresponding say to the fourth bar above. And Unlucky VC corresponds to say the second bar. Both are doing the same thing, each is just as effective as the other. Yet Lucky VC would be lauded as a genius, able to divine the future; Unlucky VC would be viewed as a failure. This is very different from the conventional story VCs like to tell: that they have better access to the best deals; provide better support; are better at picking winners, and so on. We can't say they're wrong! But it is striking, in an outlier-dominated distribution, just how much difference in outcomes can just be due to chance. And we wonder what, if anything, this may mean in the context of science.
Number of "shots on goal" matters a surprising amount: One of the strangest properties of power laws with \alpha \leq 2 is that the expected value is infinite. In the language of investment, this has the strange implication that if you just keep investing, your average return will be unbounded. This is, to put it mildly, rather strange. Imagine you invested 1 dollar and received a return of X_1 dollars, where X_1 has the power law distribution. And then you invested another dollar, and received an (independent) return X_2 with the same distribution. And just kept going. Your average return would actually just continue to keep growing, forever:
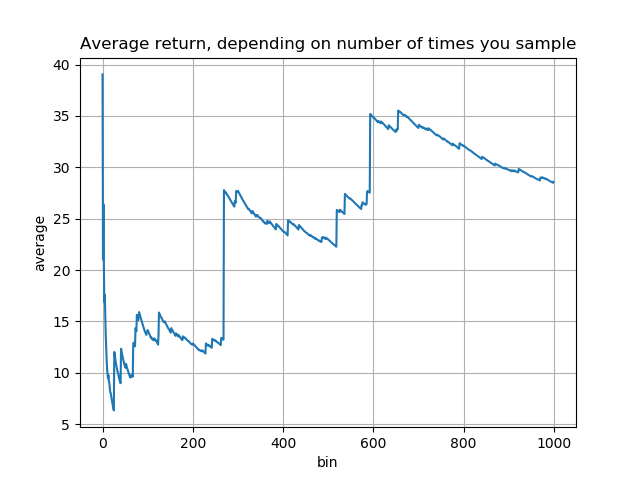
In this simulation, the very first investment turned out quite well. Followups weren't so good for a while, and the average declined. But then were some investments much better even than the first, which gradually drove the average back up. If we'd continued on beyond a thousand investments, to ten thousand, in fact the average would rise far higher still (compare the y axis scales):
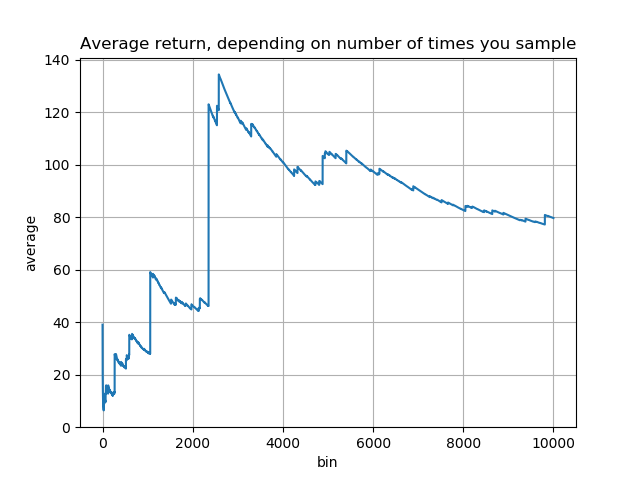
In VC we've heard this called the "spray and pray" approach. In science, it would correspond to making an enormous number of (as independent as possible) investments. In this model, the more you make the better: it's better to make far more investments of much smaller size, on the grounds that it gives you far more shots at extraordinary outlier success. Outlier-dominated distributions really are strange.
Our thinking has been informed by conversations with many people, including Alexander Berger, Patrick Collison, Laura Deming, Danny Goroff, and Abe Othman. MN's work was supported by the Astera Institute. KQ's work was supported by Generally Intelligent. Some language has been adapted from our Twitter accounts without explicit citation (which seemed tedious and unnecessary).
For attribution in academic contexts, please cite this work as:
Michael Nielsen and Kanjun Qiu, "The trouble in comparing different approaches to science funding", https://scienceplusplus.org/trouble_with_rcts/index.html, San Francisco (2022).
See, for instance: Pierre Azoulay, Turn the scientific method on ourselves, Nature (2014). A related vision may be found in: James A. Evans and Jacob G. Foster, Metaknowledge, Science (2011).↩︎
A recent survey of approaches to grant funding may be found in: Pierre Azoulay and Danielle Li, Scientific Grant Funding (2020).↩︎
Pierre Azoulay, Joshua S. Graff Zivin, and Gustavo Manso, Incentives and Creativity: Evidence from the Academic Life Sciences (2011).↩︎
Or vice versa. There's not really a null hypothesis here, although for historical reasons it's natural to treat the NIH as the default state of affairs.↩︎
Peter Thiel (with Blake Masters), Zero to One: Notes on Startups, or How to Build the Future (2014).↩︎
To prevent any confusion: we're not saying there aren't valuable things to learn from the bulk of the curve, just that it's tricky; you may be learning "best practices" that result in good businesses, but actually prevent outlier success. And there may be a great deal of value in learning from the outliers.↩︎
See: Richard Hoffer, "Something in the Air", Simon and Schuster (2009).↩︎
Of course, Facebook was very similar to earlier companies, like Friendster and Myspace; but outperformed them in crucial ways. It's possible that someone will find a way of outperforming Facebook in some crucial way. But the competitive bar has become far higher, and it's now extremely difficult to displace Facebook.↩︎
Admittedly, many discussions of scientific discovery are heavy with anecdote.↩︎
This is approximate, and there are many important caveats. See, e.g., the discussion in: Aaron Clauset, Cosma Rohilla Shalizi, and M. E. J. Newman, Power-law distributions in empirical data, SIAM Review (2009).↩︎
Abraham Othman, Startup Growth and Venture Returns (2019). Note that Othman for the most part assumes power law returns in his modeling, without subjecting that assumption to stringent tests; this kind of assumption certainly needs further investigation[fn:Clauset2009].↩︎
The idea of tenure insurance arose out of conversations between Patrick Collison and Michael Nielsen.↩︎
When we describe the latter two models people sometimes retort that many major breakthroughs arose out of routine, incremental work. This is certainly fair enough. Of course, routine, incremental work is already well-tended by existing funders. Thus, we believe it important to develop more approaches to thicken the right tail, even if it means being willing to sacrifice some performance in the middle of the curve.↩︎
Paul Krugman, How I Work.↩︎
A common criticism of such an approach is that it's "reductionist". This misunderstands both reductionism and the value of simple models. It would only be a valid critique if the simple models are taken too seriously (admittedly, a real danger, and something that does sometimes happen in, e.g., economics). But the benefits of developing powerful ideas far outweighs this risk.↩︎
There is, of course, the well-known phenomenon of multiple discovery, studied by many, including: Robert K. Merton, Singletons and Multiples in Scientific Discovery, Proceedings of the American Philosophical Society (1961). It is perhaps more accurate to say that there is usually a relatively brief window of time when a major discovery is apt to be made, perhaps multiple times.↩︎
Sriram Krishnan's interview with Marc Andreessen (2020).↩︎
Abraham Othman, Startup Growth and Venture Returns (2019). Note that Othman for the most part assumes power law returns in his modeling, without subjecting that assumption to stringent tests; this kind of assumption certainly needs further investigation[fn:Clauset2009].↩︎
One contemporary account is here. Note that one of us later founded a Y Combinator batch company, and the other worked for Y Combinator Research. But that was after Milner's program had ceased, and we don't have any information about it.↩︎
A striking example, pointed out to us by Kyle Myers, is his paper estimating the cost to cause scientists to change research direction: Kyle Myers, The Elasticity of Science, American Economic Journal: Applied Economics (2020). We'd have put this example in the main text, only the Villum Foundation example is perhaps more apt to our point.↩︎
Thomas Sinkjær, Fund ideas, not pedigree, to find fresh insight, Nature (2018). It's worth noting the extent to which this approach is the opposite of the much-lauded "people not projects". Which is right? Probably both! There's a good case to be made for the value of structural diversity in the ecosystem of scientific institutions.↩︎
A beautiful evocation of this is Jessica Watson Miller's marvelous essay Becoming a Magician (2018).↩︎